

Ancillary Data: Radiometric


What is Radiometrics or gamma-ray spectrometry?
Gamma-ray spectrometry is the measurement of natural radiation in the earth's surface, which tells us about distribution of certain soil and rock types. Radiometrics is also known as Gamma-Ray Spectrometry.
Why is it increasingly being used in the earth sciences?
Geologists and geophysicists routinely use gamma-ray spectrometry surveys as mapping tools to identify where certain rock types change. Increasingly being used for applications in study of geomorphology and soil.
Passive remote sensing technique which is relatively cheap and easy to obtain data rapidly across large areas
What is an isotope?
Each element has fixed number of
+ve charged protons in its nucleus and an equal number of
–ve electrons orbiting
Forms of an element whose nuclei have same atomic number (i.e. = number of protons in nucleus) but different atomic mass: contain different numbers of neutrons
Most common example?
For example, most common isotope of hydrogen has no neutrons at all
Also a hydrogen isotope called deuterium, with one neutron
Another, tritium, has two neutrons
What is an isotope?
Sum of protons and neutrons is mass number (e.g. helium exists as
3He (2 protons and 1 neutron) or as 4He (2 protons and 2 neutrons)
However, isotopes of an element have same chemical properties but different weights
There are "preferred" combinations of neutrons and protons, at which forces holding nuclei together balance
Light elements tend to have about as many neutrons as protons; heavy elements apparently need more neutrons than protons in order to stick together
Why are some atoms unstable?
Atoms with a few too many neutrons,
or not quite enough,
can sometimes exist for a while,
but they're unstable
How do they become stable?
Unstable isotopes
change to more stable nuclei
by emission of energetic ionising radiation: these are called radioisotopes
How many know isotopes are there?
Over 3,500 isotopes are known,
most are merely laboratory curiosities
What is the probability of disintegration?
Each radioisotope has a characteristic probability associated with radioactive disintegration called the half-life of isotope
What is the meaning of “½ life”?
Half-life of an isotope is amount of time it takes for half of atoms to decay into a more stable form
Naturally abundant isotopes exist because ½ life is longer than earths age
How much 238U is left given its “½ life”?
Uranium 238 (238U) has a half-life of 4.5 billion years so it is naturally abundant
What is Radioactivity?
Process by which an unstable atom becomes stable through breakdown, or decay, of its nucleus
In process of decay, radioactive elements can emit any distinct types of radiation
What are three main types of radiation?
Three main types of radiation, named by the first three letters of the Greek alphabet;
a alpha,
b beta, and
g gamma
a rays
Fragments of original nuclei consist of
two protons and
two neutrons
bound together into a particle identical to a helium nucleus (i.e. He2+). As they have charge and mass, are absorbed in only a few cm of air.
a particles emitted by radioactive nuclei such as uranium or radium in a process known as a decay
An example is a decay of U to daughter product of Th (½ life = 24 days)
238U92 => 234Th90 + 4He2
b (ne) rays
Identical to electrons; carry a –ve charge Not as easily absorbed as a ray and so can travel further (i.e. range of 1 m in air) Unstable atomic nuclei with excess of neutrons may undergo b − decay
Where neutron (n) converted to a
proton (p - +ve) and an electron (e -ve)
Examples: Th to Pa (½ life = 1.18 minutes) and then U (½ life = 2.48 x 10⁵ years)
234Th90 => 234Pa91 + e- + ne
234Pa91 => 234U92 + e- + ne
g rays
Emission of a or b rays usually leaves nucleus in excited state
Excess energy emitted as g ray
g rays are an energetic form of electromagnetic (EM) radiation produced by radioactive decay
Because they have no charge like a and b rays can penetrate up to 0.30 m of rock and through several hundred m’s of air
That is, and unlike a and b rays have no range but in practice few travel more than 100 m through air
g rays
Each g ray photon has a discrete energy with energy characteristic of source type
g ray energies of interest between 0.2 and 3 MeV
Energy of a g ray however depends upon particular isotope that produces it
What is radiometrics?
Radiometrics, or a gamma (g)-ray spectrometry survey, is an
Airborne or ground-based,
Passive remote sensing,
Geophysical technique
which has been used for over 20 years to detect geochemical anomalies
Approximately 90% of measured g rays are received from top 0.3 m of ground
These measurements enable the interpretation of rock and soil types
What is measured during a survey?
Spatial distribution of 3 natural radioactive elements in surface 30-45 cm of soil profile
Radioisotopes that produce g rays of sufficient energy and intensity to be measured at airborne survey heights
This includes radiometric elements of:
Crustal abundances are:
40K - 2.35 %
238U - 2.7ppm
232Th - 8.5 ppm
How can we measure g rays
g rays can be detected in a number of ways, but most useful instrument is g ray spectrometer
Why is it called a spectrometer
Because it distinguishes g rays of different energies and does not simply count total number instrument called a spectrometer
What does a spectrometer consist of?
Spectrometer consists of
a) Detector,
b) Photomultiplier, and
c) Accounting device to analyze signal
What is the detector made of and how does it work?
Consists of a large transparent crystal: usually specially treated sodium iodide (NaI)
If a g ray is absorbed in NaI crystal, it gives rise to a tiny pulse of light (i.e. flash), otherwise known as scintillation
What is the role of the photomultiplier?
Light is received and measured by photomultiplier tube which converts light flash to voltage proportional to intensity
What is the role of the counting device?
Counting device separates voltage into a number of magnitude dependent classes represent energy spectrum of g rays
Ground surveying
If spectrometer is placed on flat rock or soil surface, most g rays it detects will come from saucer shaped volume ~ 2 m across
From this volume approximately 60 % of g rays originate in darker shaped volume, since those further away will not penetrate
Volume shown is approximately volume of measurement for granite, however this will be smaller for denser rocks
Ground surveying
Even so spectrometer will not count all g rays as many do not get emitted in direction of spectrometer
In addition some may pass through NaI crystal or be absorbed prior to reaching crystal
Several readings are often taken in same place to generate average values
Instrument can also be calibrated in locations where actual concentrations of radioelement has been determined
Errors associated with measurement
Count rate also dependent on solid angle of rock about spectrometer
If spectrometer placed on edge of step or cliff count would be reduced to ~ half because of absence of missing matter
Conversely, if spectrometer placed at base of step/cliff count would give reading ~ 50% larger because absence of missing matter
Airborne
Typically regional airborne geophysical survey would be flown with 400 m line spacing and at a height of 100 m
Modern airborne g ray spectrometric data acquisition systems for regional mapping comprise a 256 channels of data in energy range 0-3 MeV
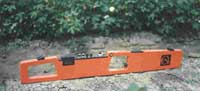
Exploranium: GR256
Spectrometer that measures
Channel 1: Total Count
Channel 2: Potassium (K)
Channel 3: Uranium (eU)
Channel 4: Thorium (eTh)
How is radiometric data displayed?
Commonly displayed as a map, with colours representing sample values
Values collected along flight lines are transformed into a coloured map with 100% coverage of area
Data collected as points along flight lines that are a certain distance apart
Grid applied to area, and empty grid cells have values calculated (interpolated) from neighbouring cells
Each grid cell is assigned a colour based on its cell value
Ternary maps
Combine three datasets on one picture using a
Red (40K)
Green (Th)
Blue (U)
ternary ratio
What is a Ternary plot?
Combine three datasets on one picture using a red-green-blue ternary ratio
Each displayed using a different basic colour, combined make colorful display
Whereby each shade represents different relative amounts of K, U and Th
Relative amounts are displayed as follows:
Red = Potassium (K)
Blue = Uranium (U)
Green = Thorium (Th)
Ternary plots: Indicative Interpretation
Red = high K with low Th and U
Green = high Th with low K and U
Blue = high U with low Th and K
Cyan = high U with high Th but low K
Magenta= high U with high K but low Th
Yellow = high K with high Th but low U
White = high K with high Th and high U
Ternary plot: Icely Granite & surrounds
Black = low K with low Th and low U
Cyan = high U with high Th but low K
Red = high K with low Th and U
Yellow = high K with high Th but low U
White = high K with high Th and high U
Igneous rocks
U and Th are both rare but tend to be concentrated in magmas, particularly those with higher silica contents
For example granite/rhyolite has more of these elements than basalt
Th is concentrated in magmas, particularly those with higher silica contents such as monazit
Occurs usually in small isolated crystals
Potassium (40K)
Major component of earths crust
Major hosts in rocks are
Potassic feldspars
(Orthoclase and Microline ~ 13% K)
micas
(Biotite and Muscovite ~ 8% K)
During weathering, major K hosts will be destroyed in order
Biotite
K-feldspar
Muscovite
K released in weathering can be taken up by K-bearing clay minerals such as Illite
Hydrolysis: orthoclase to illite
Reactions subject chemical equilibria laws, with mineral breakdown proceeding beyond equilibria if components are added/removed
Orthoclase
(Potassium Feldspar)
If some potash (KOH) is retained illite forms
Potassium (40K)
It can emit a b ray, becoming 40Ca
(89% of all decays) It can receive an orbital electron and become 40Ar (11% of all decays)
emitting g ray of 1.46 MeV
Series ends in stable isotope of lead
© Copyright UNSW 2007 | Terms of use | Privacy Policy