

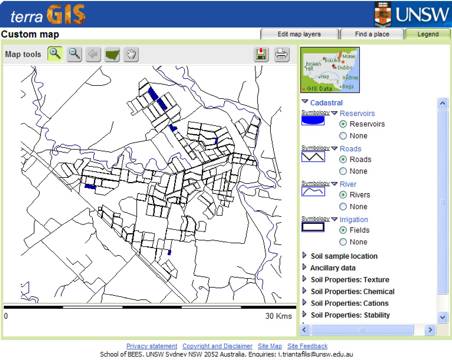
Custom map window
When terraGIS is initiated the study area selected by default and which will first appear in the Custom map window is the cadastral data (i.e. reservoirs, roads, rivers and irrigation fields) of the Trangie Irrigation District (lower Macquarie valley).
Custom map tools
![]()
In the top left-hand corner of the terraGIS web page and immediately above the Custom map window, various Custom map tools are available to navigate and view the various biophysical data layers of the selected study area.
Zoom ![]()
The first two Custom map tools allow the user to zoom in (+) and zoom out (-). The zoom in tool is selected by default. The user can zoom in in one of two ways. The easiest way is to place the cursor in the Custom map window and using the left mouse button, click on any point of interest.
Alternatively, and if a greater degree of control and/or zoom in is needed, clicking, holding and dragging the left mouse button over the area of interest is required. Step by step this can be achieved by first left clicking the mouse button, near the top left hand corner of the area of interest, within the Custom map window. With the left mouse button still depressed, the cursor can be dragged over and toward the lower right hand corner of the area of interest. As this is done, the area selected will appear within a red box.
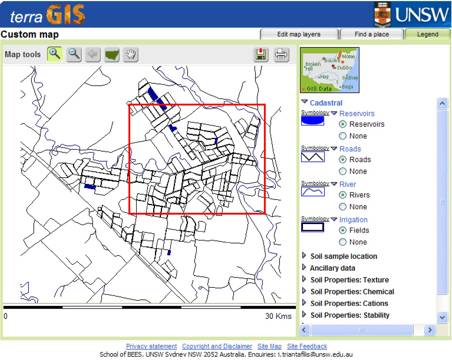
Releasing the left mouse button will result in a more detailed (i.e. zoom in) representation of the requested biophysical data for the study area that is current.

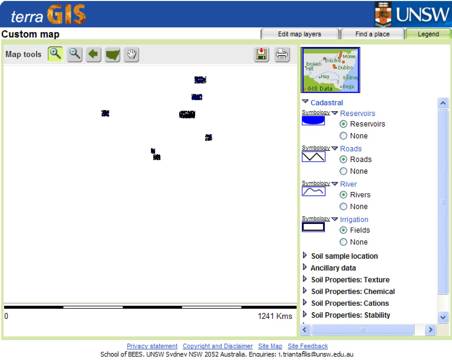
In order to zoom out, the zoom out (-) tool needs to be selected and placed anywhere on the map of interest whilst the left mouse button is clicked.
![]()
Back ![]()
The third tool listed in the Custom map tool bar allows the user to return or go back to the original or default zoom within the study area that is current. Previous zoom in maps will also be viewed in the reverse sequence in which they were requested.
![]()
State ![]()
The NSW State icon in the Custom map tool bar will allow the user to view all of the seven irrigated cotton growing districts in the five Catchment Management Areas where terraGISbiophysical data is available.
In order to zoom in on any particular study area of interest, the zoom in tool needs to be selected and using the click, hold and drag option of zoom in described previously, a given study area can be selected.
![]()
Move ![]()
The last of the navigation Custom map tools shown will allow the user to move the zoom in window of biophysical information. In order to use the move tool simply select the tool and place the mouse over the Custom map. The move icon will appear in the Custom map window and once the left mouse button is clicked and held, the biophysical data layer of interest in the study area selected can be moved horizontally, vertically or in the general direction required.
![]()
Save and print ![]()
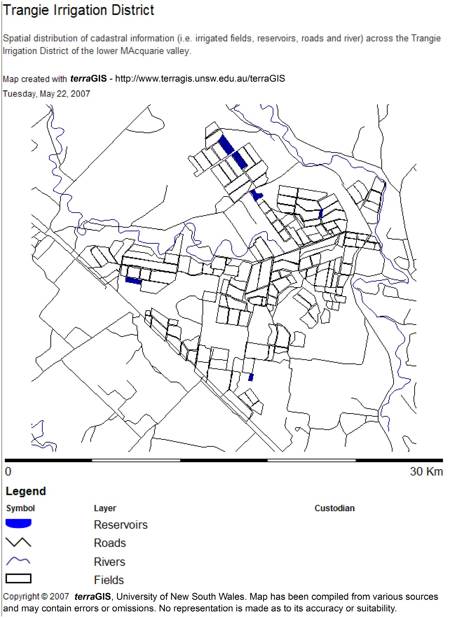
The final two icons which appear on the far right of the Custom map tool barmenu will allow the user to save and/or print to a disk or hard copy of the current view in the Custom map window.
The first option available enables the user to save the information shown in the Custom map window as either a .png or .bmp file. Clicking on the first or save to disk icon brings up the Save map dialogue box. Clicking on the Save map widget on the right hand side brings up a Save Picture dialogue box. An appropriate descriptive name for the map file can be assigned prior to saving it to a Folder on a hard disk.

A second option is available, which allows the user to print the information shown in the Custom map window so as the biophysical data layer can be retained as a hard copy. Clicking on the second or print icon brings up a print dialogue box. An appropriate descriptive name for the file can be assigned prior to print.

By depressing the Next widget located in the lower right hand corner of the Print dialogue box allows the final image shown in the Custom map window to be sent to the printer.
© Copyright UNSW 2007 | Terms of use | Privacy Policy