

terraGIS: Orientation and Navigation
In order to use terraGIS the following page provides a few basic operational and navigational instructions. The first thing to become familiar with is that the terraGIS web page consists of three basic components.
These are the:
- Custom map window,
- Find a place menu bar, and
- Legend menu bar.
The Custom map window is located on the left hand side of the terraGIS web page. It is the window which facilitates the visual display of the biophysical data layer of interest as generated for the irrigated cotton growing area that is current.
The Find a place menu bar is located near the top right hand corner of the terraGIS web page. Selecting this menu bar allows the user to choose which of the seven different irrigation study areas is current (e.g. Trangie, Warren, etc.,).
The Legend menu bar is also located in the top right hand corner of the terraGIS web page. Selecting this menu bar allows the user to select any of the biophysical data layers (e.g. Soil Properties: Texture, etc.,) available in terraGIS.
In order to choose another irrigated cotton growing district, the Find a place menu bar needs to be activated. It is located near the top right hand corner of the terraGIS web page beneath the UNSW logo.
Selecting this menu bar allows the user to choose which of the seven different study areas (e.g. Trangie, Warren, etc.,) will be active in terms of the biophysical data layers that will appear in the terraGIS Custom map window.
The appropriate study area can be selected from the list of study areas (i.e. Bourke, Trangie, Warren, Toobeah, Ashley, Wee Waa and Gunnedah) which will drop down once the user clicks on the Go to a study area dialog box. This widget appears beneath the small map of the State of NSW.
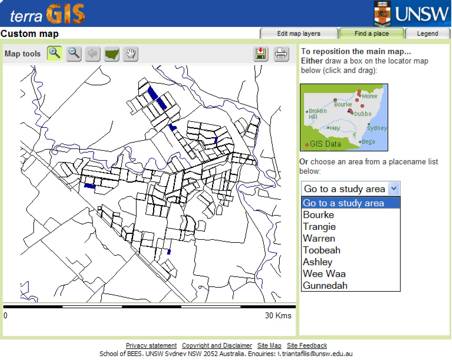
NOTE: A common problem that will arise is that once you change from viewing the biophysical data layer from one study area to another, that is by going to the Find a place menu bar, you will need to change back to the Legend menu bar in order to use any of the Custom map tools to view the study area you have just selected (e.g. ‘zoom in’ and ‘zoom out ‘) in more detail.
By default all the cadastral information available in each of the irrigated cotton growing areas available in terraGIS is always shown. This includes the location of water storage reservoirs, irrigated fields, roads and major water courses (e.g. rivers). These have been included to assist individual growers and consultants to orientate themselves but not directly identify a given landholding. At any point in time this information can be switched off by depressing the ‘None’ widget available for each cadastral layer.

In order to view any of the other biophysical data layers available in terraGIS the user simply needs to select the appropriate biophysical data layer from the Legend in the right hand panel of the terraGIS web page.
© Copyright UNSW 2007 | Terms of use | Privacy Policy